Modeling Optocouplers with Spice

Spice models of optocouplers are still rarely and seldom provided by the manufacturers. This post shows you a methodology of how you can easily model an optocoupler with a delay characteristic, an input current dependent CTR and a transistor output. It is based on the application note AN3017 from the CEL [1] and intends to demonstrate tools to dimension the components.

Block Diagram IL213 (from Vishay datasheet)
The block diagram above is implemented as subcircuit as shown in the figure below. There is a slight difference to the application note mentioned before. In this version the CTR(If) function is implemented as a TABLE function instead of a polynom interpolation. The subcircuit calculates the CTR with a voltage controlled voltage Source (Ectr) and multiplies the result with the delayed photodiode current If which is represented by the voltage at the net Ndelay.
 1. Determine the diode
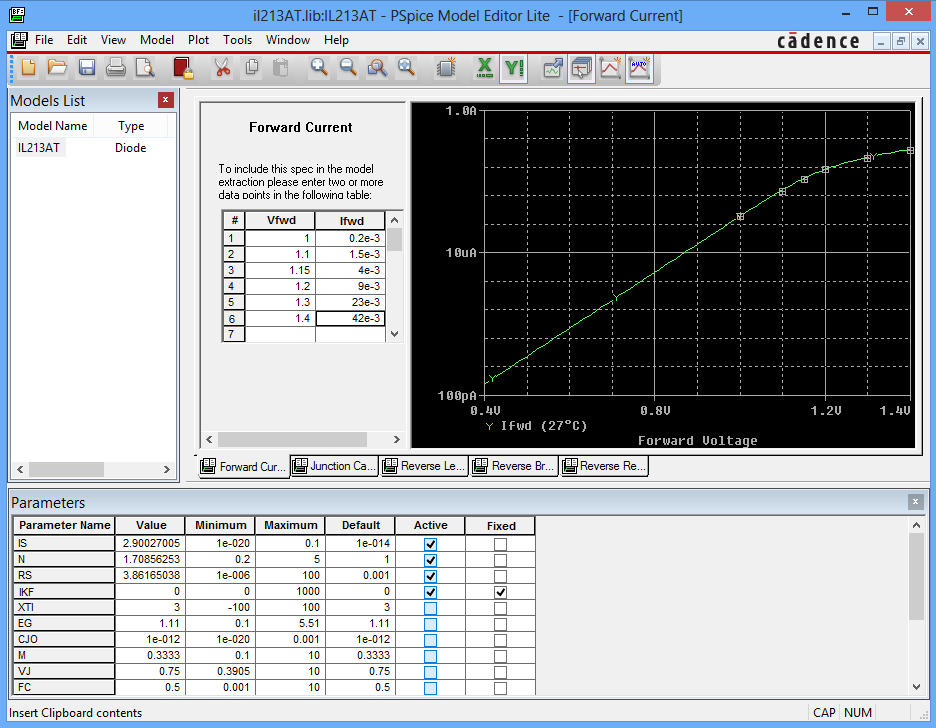
In almost all datasheets you find the V-I Characteristic. Use the PSpice model editor to determine the model parameters of the photodiode. For static behaviour it is only necessary to fit the parameters Is, N and Rs. Other parasitic parameters can be added when provided by the manufacturer.
If you don’t have PSpice it might be of interest that PSpice Lite (Demo Version) also comes with an Model Editor version which includes a fitting function for diodes.
2. Dimension the RC delay element
The delay network represents the diode current and adds the dynamic behaviour to the subcircuit. The voltages at Nrx and Ndelay represent mathematically the diode current and do not have connections to the subcircuit pins. Therefor aslong as you are in the numeric range of your simulation engine the behaviour depends on the ratios of the components. In this example Rd is set to 10kΩ and the Condensator Cd is calculated with the following formula. The rise time tr or an other dynamic value as switching time ton is normally provided in the datasheet. The formulas are derived from the charging characteristic of a conedsator for 10% and 90% of the end voltage.
3. Get CTR table values
The current transfer ratio CTR of the most Optocoupler are strongly dependend on the current of the photodiode current If. Therefor the CTR is calculated in dependence of the delayed If. In the application note [1] the CTR(If) function is implemented by two polyinomial interpolation functions. In this version the CTR function is directly implemented with a TABLE and get a continuous CTR function with linear interpolation handled by PSPICE.
You can extracted the datapoints for example with the online tool WebPlotDigitizer [2] and enter them into a TABLE function in the netlist.

4. Set Output Transistor Parameters
Normaly you do not find model parameters in an optocoupler datasheet. Therefor the output transistor is modeled with default parameters. Except the forward beta BF is set to a type specific CTR value in percent. But take care, NPN models do not make sense with too low or too high values. It should be between 50 and 1000.
The transistor forward beta is defined by the param value CTRnom so it has to be change only one time in the source code.
Even though not every detail of the transistor is implemented. With a transistor model at the output you have the saturation effect at the output. Alot of optocoupler SPICE models are just implemented with a current source at the output.
5. Complete Netlist
*******************************************************************************
* IL213AT
*******************************************************************************
*             	anode of diode
*               | cathode of diode
*               | | transistor collector
*               | | |  transistor base
*               | | |  |  transistor emitter
*            	| | |  |  |
.SUBCKT IL213AT	A C CT BT ET
.param CTRnom = 100

* photo diode
D1		A Nin		DLED
VSense  Nin C		0Vdc			;0V voltage source to measure LED current
* diode model fitted by pspice model editor
.model DLED D IS=2.900270051074e-014 N=1.708562534153 RS=3.861650388855

* delay stage
Hd Nrx 0		VSense 1
Rd Nrx Ndelay	10k
Cd Ndelay 0		130.3pF			;Cd=3us / (-10kOhm * ln(0.1))

* CTR depending on If
* table extracted with Web Plot Digitizer from the vishay datasheet
Ectr Nctr 0 TABLE {V(Ndelay)}
+ (0.000102759,0.127981645)
+ (0.000127403,0.152332659)
+ (0.000152012,0.17668851)
+ (0.000174544,0.199307905)
+ (0.000209866,0.230627961)
+ (0.000256243,0.26716996)
+ (0.000301088,0.30284615)
+ (0.000362032,0.347225903)
+ (0.000438674,0.399440506)
+ (0.000523442,0.449915751)
+ (0.000619818,0.502133257)
+ (0.000722759,0.554352697)
+ (0.000849297,0.610053756)
+ (0.001005681,0.666624493)
+ (0.001186316,0.728419594)
+ (0.00144307,0.801529228)
+ (0.001782582,0.8816021)
+ (0.002151776,0.949488823)
+ (0.00258746,1.013893445)
+ (0.003099428,1.076557257)
+ (0.003770021,1.128771376)
+ (0.004746594,1.160956274)
+ (0.005817233,1.161801285)
+ (0.007294818,1.132170767)
+ (0.008904884,1.087742645)
+ (0.010786891,1.032867733)
+ (0.013166855,0.964932157)
+ (0.015586292,0.903965622)
+ (0.018169419,0.846483607)
+ (0.022008655,0.778548999)
+ (0.025656104,0.720196338)
+ (0.030839899,0.654874636)
+ (0.036787897,0.59216584)
+ (0.043548581,0.538164477)
+ (0.049233379,0.498099261)

*transistor output
Gtrans 	CT	BT	Value = {V(Ndelay)*V(Nctr)/CTRnom}
Qo		CT	BT	ET	ET phototransistor
.model phototransistor NPN BF={CTRnom}
.ENDS
Summary
As always in electronics simulating a model of a complex component works only for the simulation for which it is build for. This presented solution works with transient analysis and simulate static and dynamic effects. Not implemented are temperature dependency of the CTR function. AC sweeps are not possible.


